Has Your Home Equity Shrunk? Check Your State and Your Numbers
When did you last check what your home is worth? If the answer is sometime in 2022, your number is probably out of date. The share of homeowners with a large equity cushion has dropped in almost every state, and the drop matters most when you go to use that equity.
This guide shows where your state stands, how to check your own number in a few minutes, and what that number means for your options.
The Scout Executive Summary
- Most states are down. The share of equity-rich homeowners fell in 45 of the 49 states ATTOM ranked for the second quarter of 2026.
- Your own number matters more than your state’s. A state average cannot tell you where you stand. Three steps can.
- Small price dips hit hard. In our example, a 5% drop in home value cuts the amount a homeowner can borrow by 30%.
- Most long-time owners are still in good shape. The owners with the least room are those who bought in 2022 or later with a small down payment.
In This Article:
- Has Home Equity Fallen in Your State?
- How Do You Check Your Own Home Equity?
- Where Does Your Home Equity Stand?
- What Does Your Equity Number Mean for Your Options?
- What If You Bought Your Home Recently?
- Which States Lost the Most Ground?
- What Happened to Home Equity in Arizona and California?
- Why Are Fewer Homeowners Equity-Rich?
- Should You Tap Your Equity Now or Wait?
- Frequently Asked Questions
Has Home Equity Fallen in Your State?
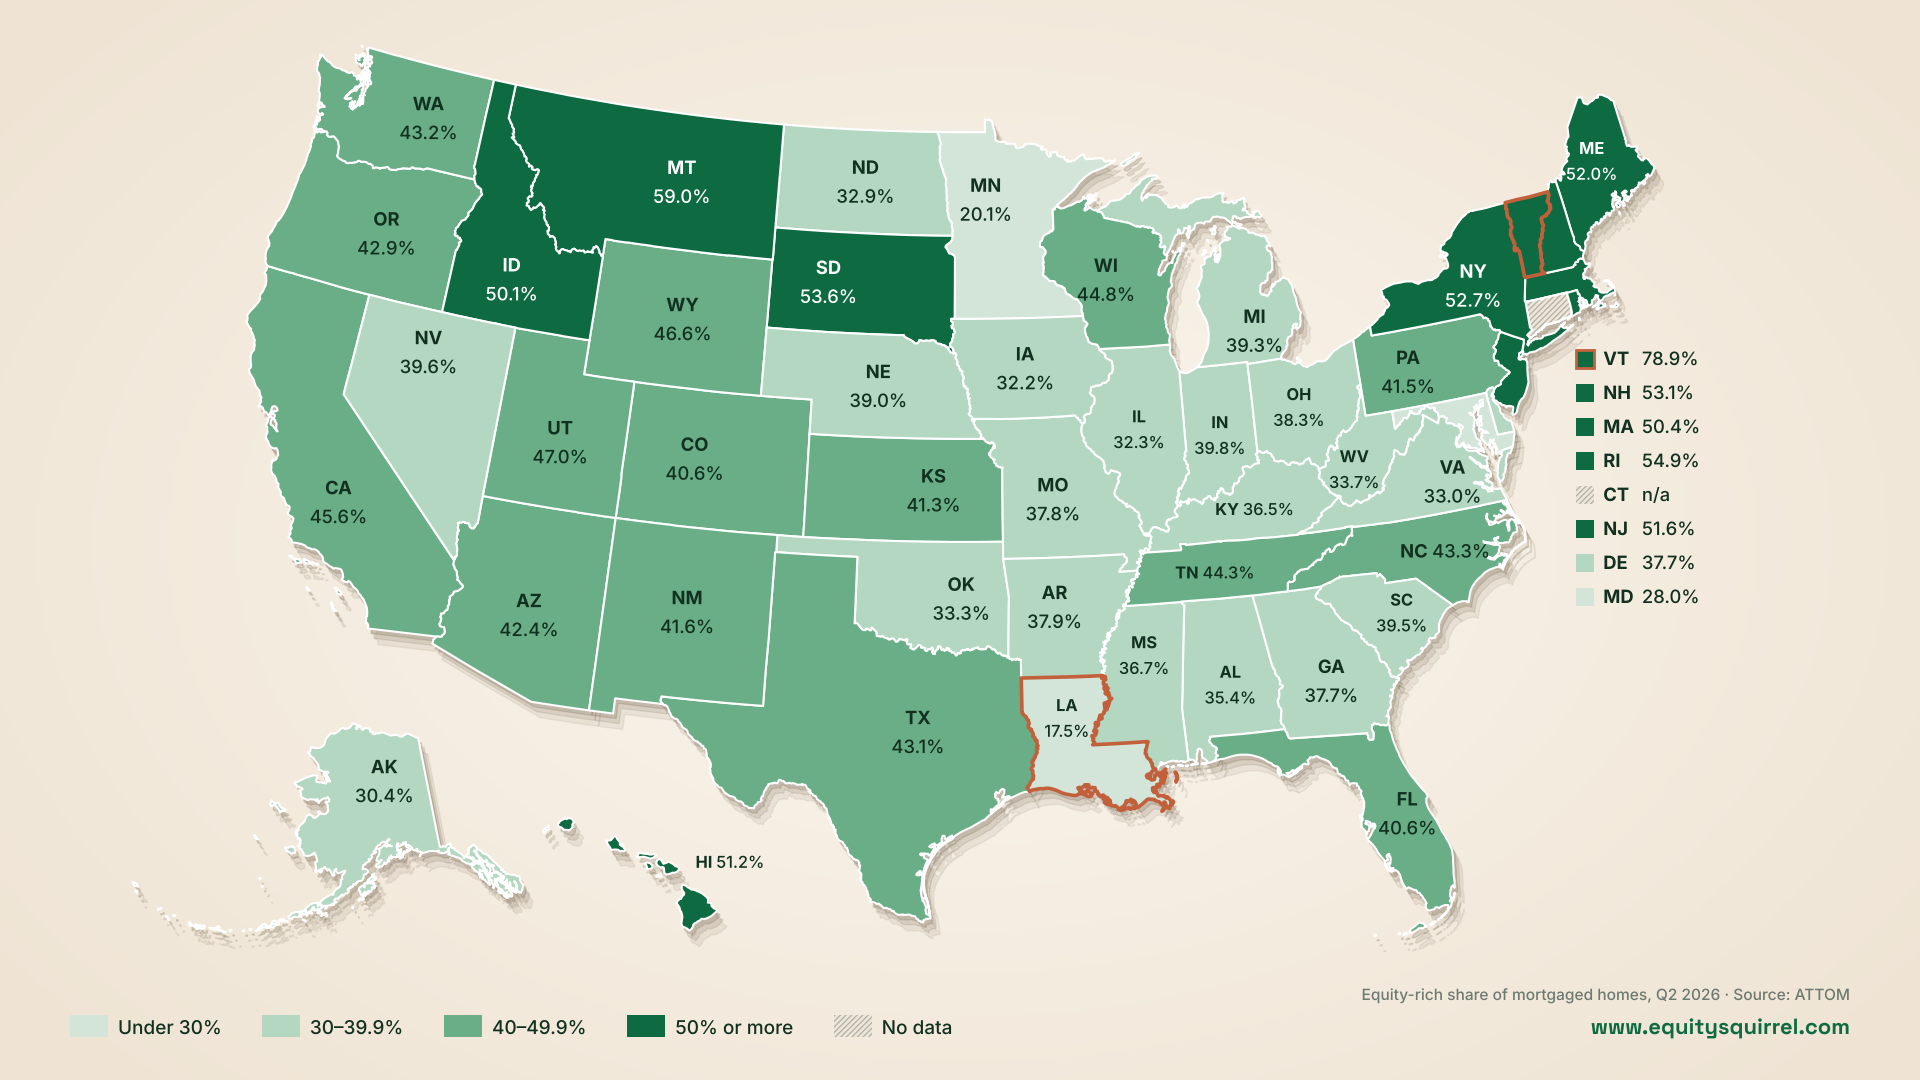
Yes, in almost every state. A home counts as “equity-rich” when the loans against it add up to half or less of what the home is worth. Property data firm ATTOM tracks how many homes with a mortgage meet that mark.
In the second quarter of 2026, 41.1% of mortgaged homes in the U.S. were equity-rich. A year earlier, it was 47.4%. ATTOM says the national share is at its lowest point in nearly five years.
The drop was broad. The equity-rich share fell in 45 of the 49 states ATTOM ranked. Only North Dakota, South Dakota, Kentucky and Wyoming went up.
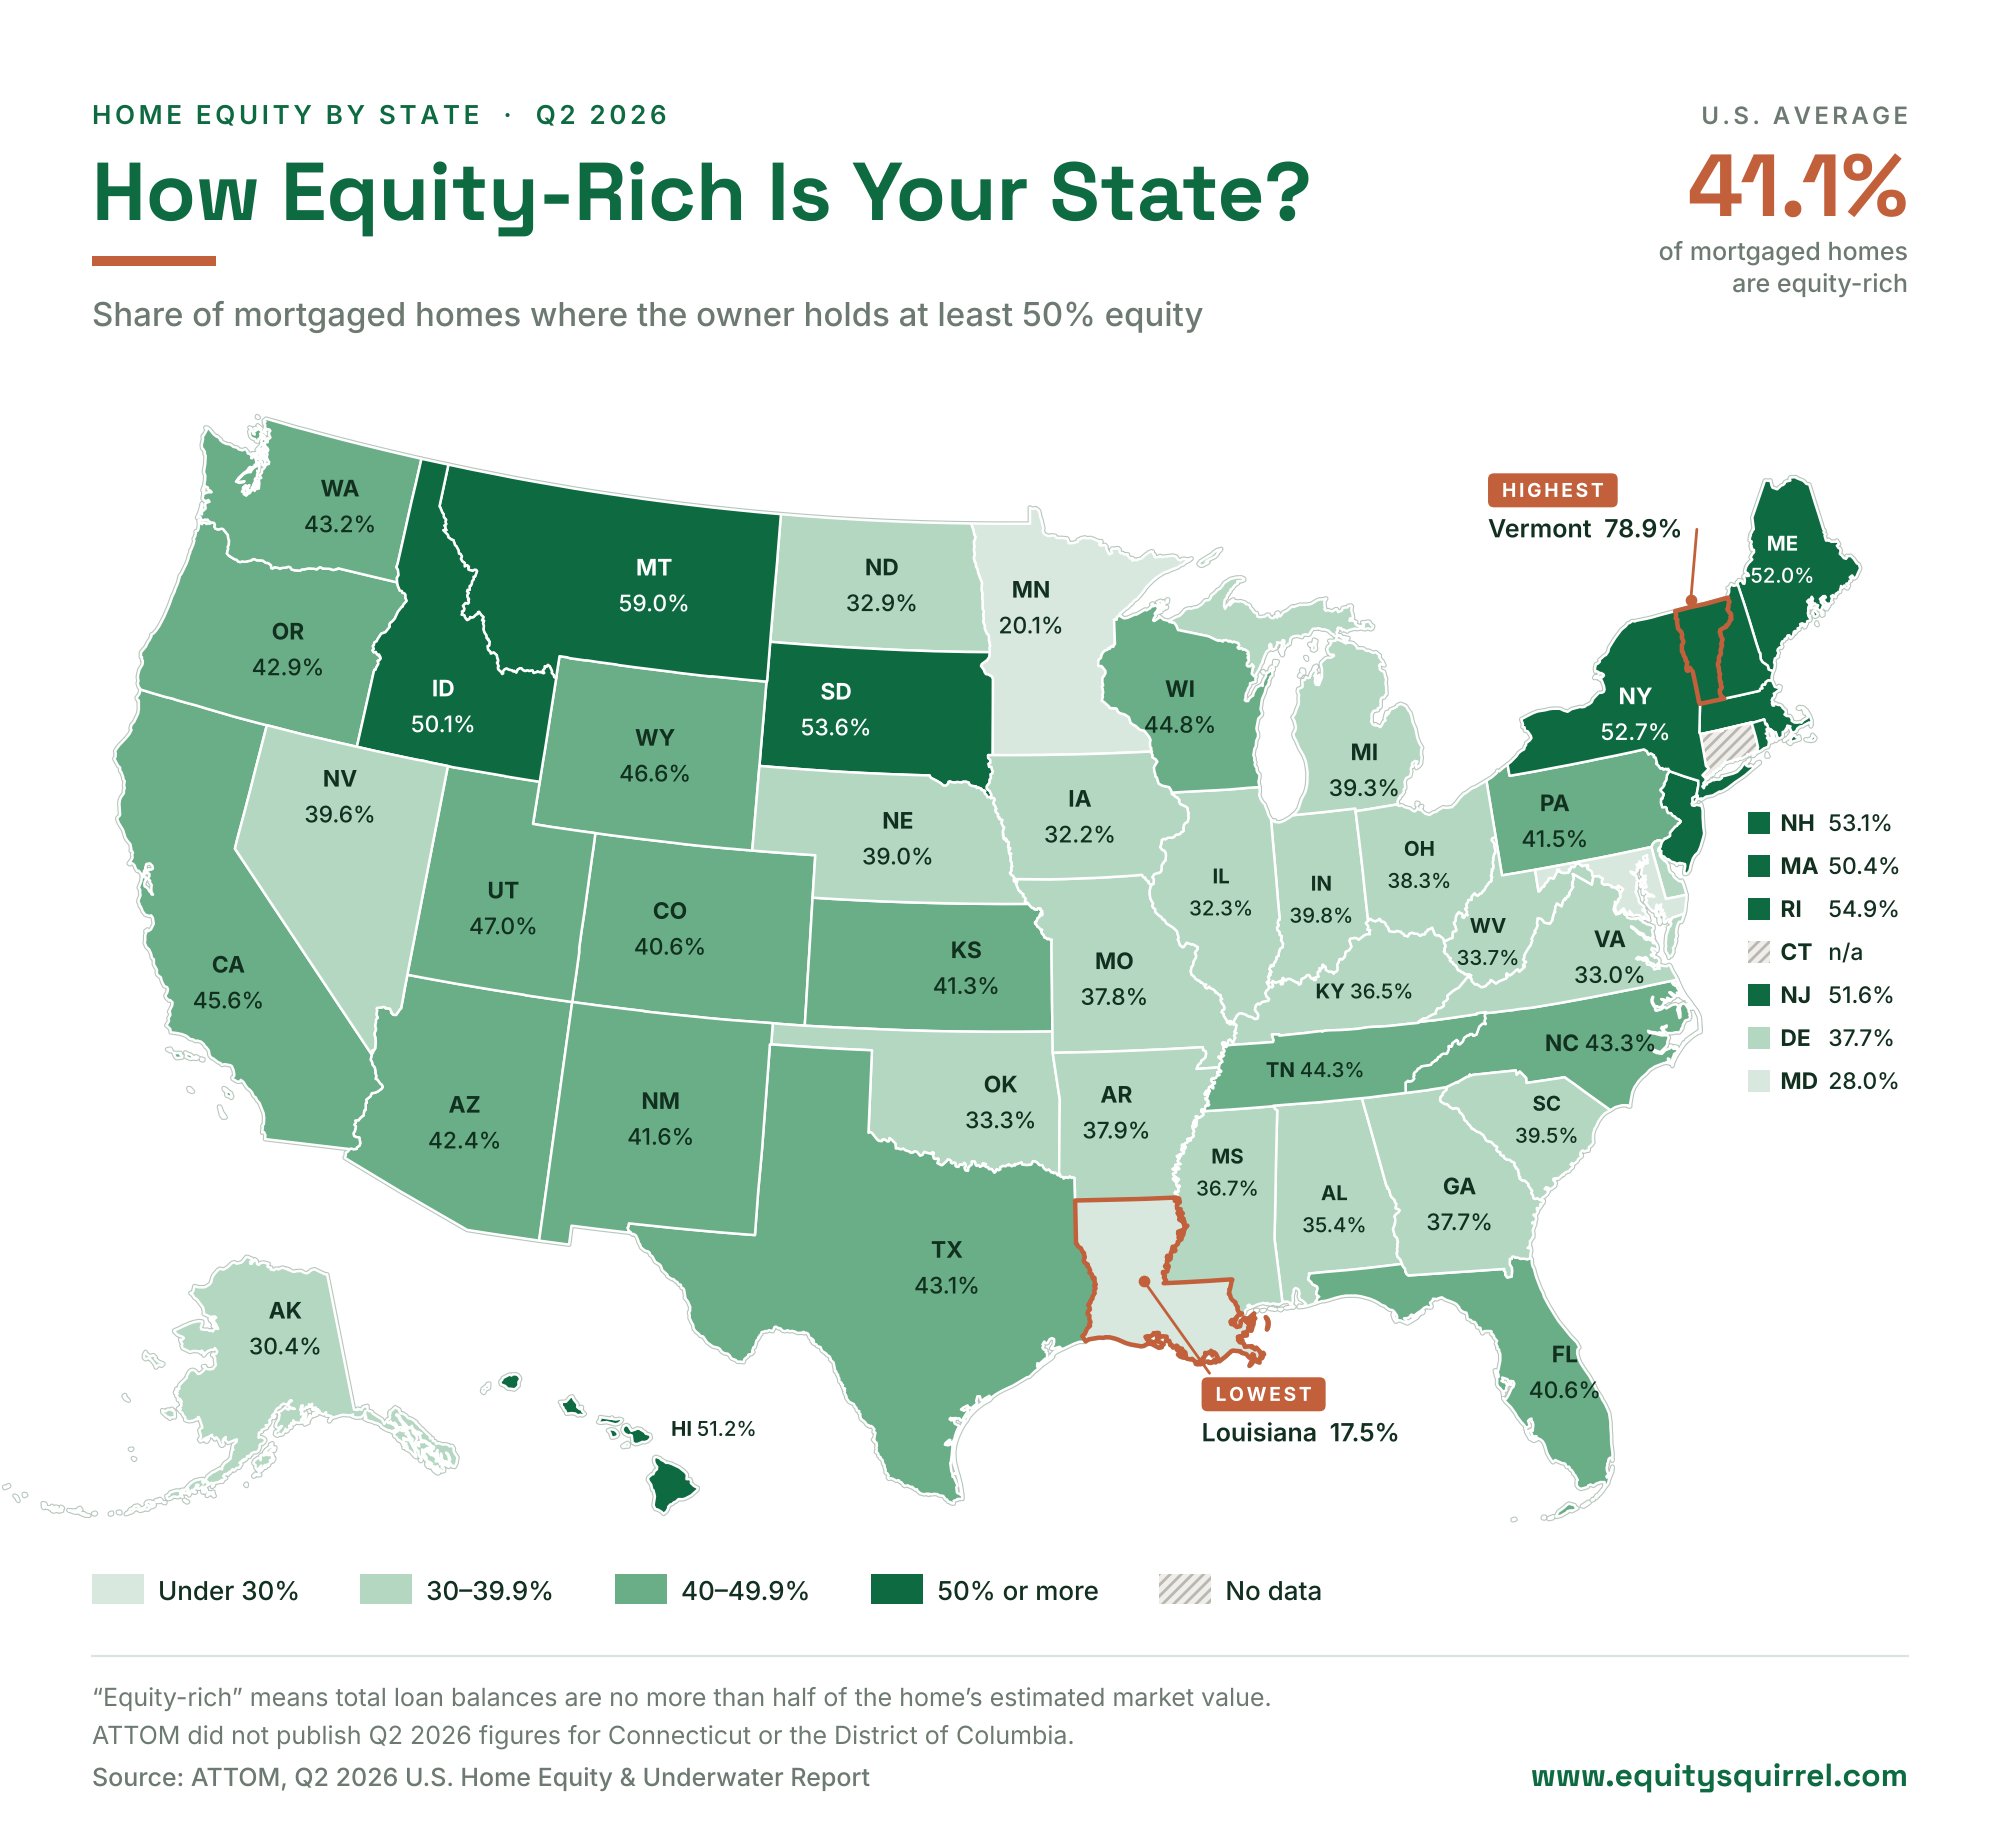
Find your state in the table below. It shows the share of mortgaged homes that were equity-rich this year and one year ago.
| U.S. average | 41.1% | 47.4% | ▼ 6.3 pts |
| AlabamaRank 39 of 49 | 35.4% | 41.4% | ▼ 6.0 pts |
| AlaskaRank 46 of 49 | 30.4% | 33.7% | ▼ 3.3 pts |
| ArizonaRank 21 of 49 | 42.4% | 48.6% | ▼ 6.2 pts |
| ArkansasRank 33 of 49 | 37.9% | 39.0% | ▼ 1.1 pts |
| CaliforniaRank 14 of 49 | 45.6% | 56.9% | ▼ 11.3 pts |
| ColoradoRank 25 of 49 | 40.6% | 46.5% | ▼ 5.9 pts |
| DelawareRank 35 of 49 | 37.7% | 43.2% | ▼ 5.5 pts |
| FloridaRank 26 of 49 | 40.6% | 48.5% | ▼ 7.9 pts |
| GeorgiaRank 36 of 49 | 37.7% | 43.3% | ▼ 5.6 pts |
| HawaiiRank 9 of 49 | 51.2% | 59.2% | ▼ 8.0 pts |
| IdahoRank 11 of 49 | 50.1% | 56.1% | ▼ 6.0 pts |
| IllinoisRank 44 of 49 | 32.3% | 36.6% | ▼ 4.3 pts |
| IndianaRank 27 of 49 | 39.8% | 45.3% | ▼ 5.5 pts |
| IowaRank 45 of 49 | 32.2% | 33.0% | ▼ 0.8 pts |
| KansasRank 24 of 49 | 41.3% | 42.6% | ▼ 1.3 pts |
| KentuckyRank 38 of 49 | 36.5% | 35.1% | ▲ 1.4 pts |
| LouisianaRank 49 of 49 | 17.5% | 18.0% | ▼ 0.5 pts |
| MaineRank 7 of 49 | 52.0% | 58.3% | ▼ 6.3 pts |
| MarylandRank 47 of 49 | 28.0% | 34.1% | ▼ 6.1 pts |
| MassachusettsRank 10 of 49 | 50.4% | 58.2% | ▼ 7.8 pts |
| MichiganRank 30 of 49 | 39.3% | 50.8% | ▼ 11.5 pts |
| MinnesotaRank 48 of 49 | 20.1% | 37.6% | ▼ 17.5 pts |
| MississippiRank 37 of 49 | 36.7% | 40.4% | ▼ 3.7 pts |
| MissouriRank 34 of 49 | 37.8% | 46.1% | ▼ 8.3 pts |
| MontanaRank 2 of 49 | 59.0% | 59.2% | ▼ 0.2 pts |
| NebraskaRank 31 of 49 | 39.0% | 41.9% | ▼ 2.9 pts |
| NevadaRank 28 of 49 | 39.6% | 43.3% | ▼ 3.7 pts |
| New HampshireRank 5 of 49 | 53.1% | 60.3% | ▼ 7.2 pts |
| New JerseyRank 8 of 49 | 51.6% | 53.6% | ▼ 2.0 pts |
| New MexicoRank 22 of 49 | 41.6% | 46.4% | ▼ 4.8 pts |
| New YorkRank 6 of 49 | 52.7% | 55.3% | ▼ 2.6 pts |
| North CarolinaRank 17 of 49 | 43.3% | 48.0% | ▼ 4.7 pts |
| North DakotaRank 43 of 49 | 32.9% | 30.2% | ▲ 2.7 pts |
| OhioRank 32 of 49 | 38.3% | 43.1% | ▼ 4.8 pts |
| OklahomaRank 41 of 49 | 33.3% | 33.9% | ▼ 0.6 pts |
| OregonRank 20 of 49 | 42.9% | 49.1% | ▼ 6.2 pts |
| PennsylvaniaRank 23 of 49 | 41.5% | 45.8% | ▼ 4.3 pts |
| Rhode IslandRank 3 of 49 | 54.9% | 60.3% | ▼ 5.4 pts |
| South CarolinaRank 29 of 49 | 39.5% | 42.6% | ▼ 3.1 pts |
| South DakotaRank 4 of 49 | 53.6% | 52.1% | ▲ 1.5 pts |
| TennesseeRank 16 of 49 | 44.3% | 50.3% | ▼ 6.0 pts |
| TexasRank 19 of 49 | 43.1% | 48.8% | ▼ 5.7 pts |
| UtahRank 12 of 49 | 47.0% | 52.0% | ▼ 5.0 pts |
| VermontRank 1 of 49 | 78.9% | 84.9% | ▼ 6.0 pts |
| VirginiaRank 42 of 49 | 33.0% | 38.7% | ▼ 5.7 pts |
| WashingtonRank 18 of 49 | 43.2% | 52.4% | ▼ 9.2 pts |
| West VirginiaRank 40 of 49 | 33.7% | 36.4% | ▼ 2.7 pts |
| WisconsinRank 15 of 49 | 44.8% | 50.6% | ▼ 5.8 pts |
| WyomingRank 13 of 49 | 46.6% | 45.3% | ▲ 1.3 pts |
Change is in percentage points. Tap a column header to sort.
ATTOM did not publish second-quarter figures for Connecticut or the District of Columbia.
Keep one thing in mind as you read the table. These numbers cover homes with a mortgage. If you own your home free and clear, you are not in the count, and all of your home’s value is equity.
Own your home outright? See if you pre-qualify with Unlock for a home equity agreement, with no monthly payments.
How Do You Check Your Own Home Equity?
You can check your home equity in three steps: estimate what your home is worth today, add up every loan on it, and divide. The result tells you how much of your home’s value you owe.
- Estimate today’s value. Look at what similar homes near you have sold for in the last three to six months. Do not use the price from the market peak, and treat online estimates as a starting point. A lender will order its own valuation.
- Add up every loan on the home. Include your mortgage balance, any home equity loan, and the amount you have drawn on a HELOC. A HELOC is a home equity line of credit, which works like a credit card secured by your home.
- Divide the loans by the value. If you owe $225,000 on a home worth $450,000, you owe 50% of its value.
Where Does Your Home Equity Stand?
Two neighbors can own identical homes on the same street and be in completely different places. One has room to borrow, renovate or retire comfortably. The other has almost no cushion at all. The difference is how much each one still owes, and your number shows which side you are on.
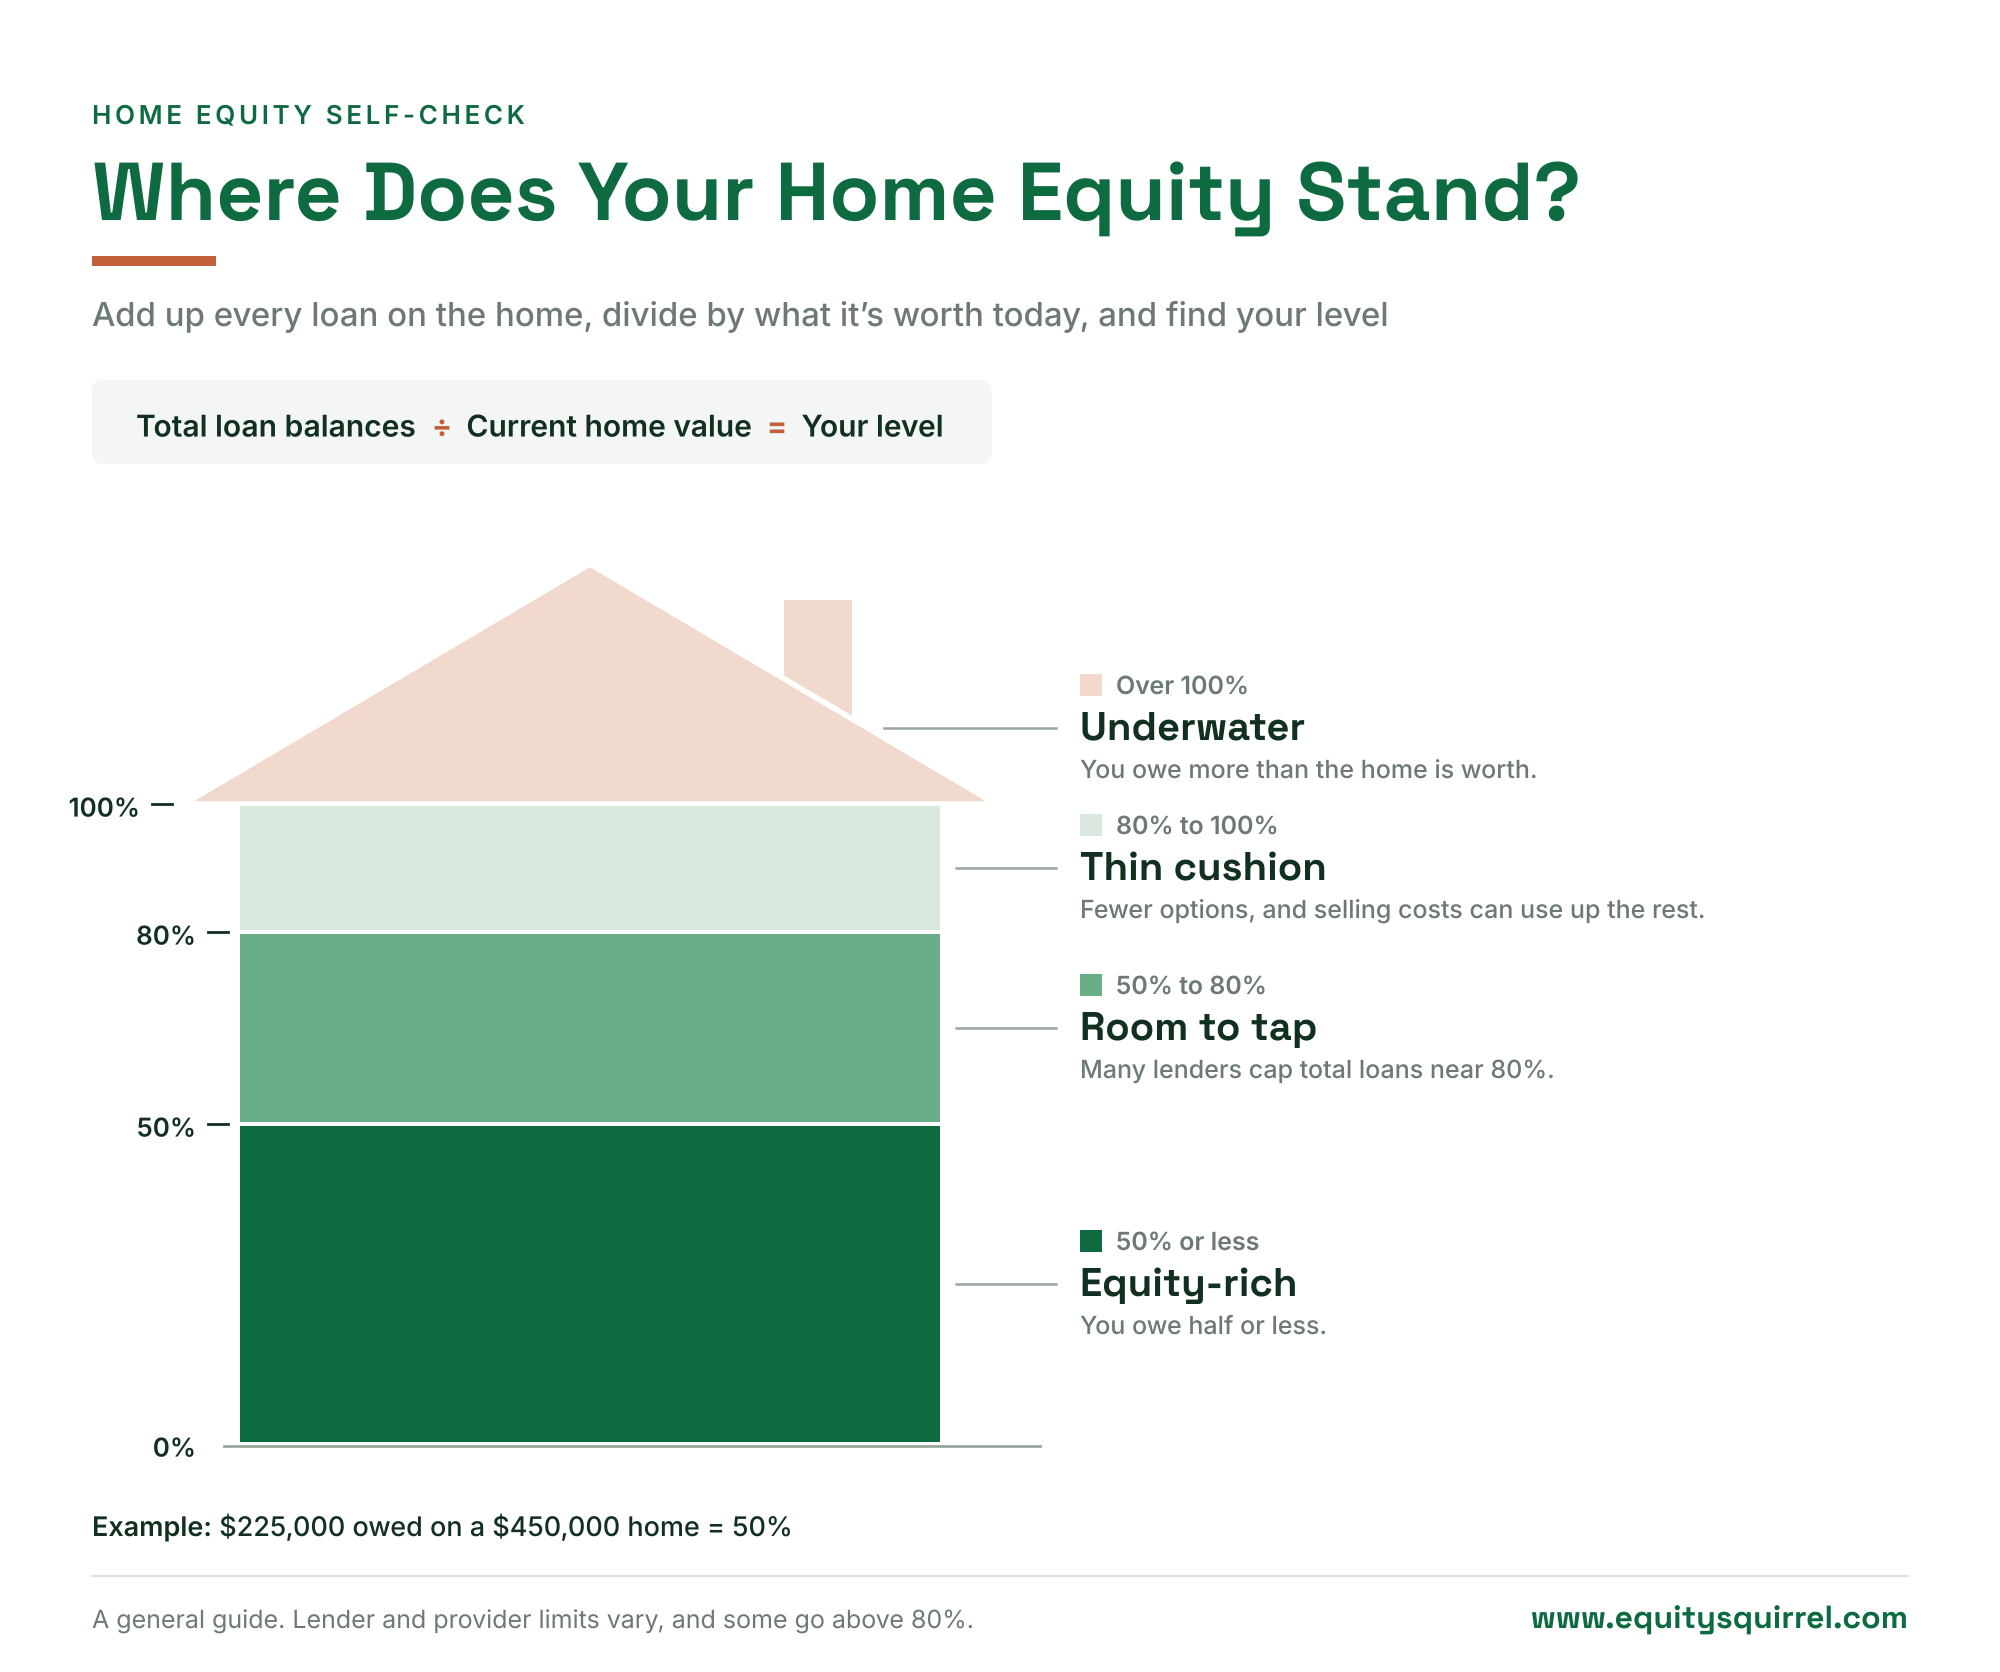
Here is how to read your result:
- 50% or less: equity-rich. You owe half or less of what the home is worth.
- 50% to 80%: room to tap. Many lenders cap total loans on a home near 80% to 85% of its value, so there is often room to work with here.
- 80% to 100%: thin cushion. You have fewer options, and the costs of selling can use up what is left.
- Over 100%: underwater. You owe more than the home is worth.
Landed in the equity-rich or room-to-tap range? Check your pre-qualification with Hometap in just a few minutes. Get Your Estimate →
What Does Your Equity Number Mean for Your Options?
Your equity number decides which options are open to you and how much money you can access. The same home can qualify for very different amounts depending on where that number falls.
If you want a HELOC or a home equity loan. Lenders set a ceiling on the total loans they will allow against a home. That ceiling is often 80% to 85% of the home’s value, and it includes your current mortgage. What you can borrow is the space between your mortgage balance and that ceiling.
Thinking about a HELOC? Check your APR with a new HELOC lender. It won’t affect your credit score.
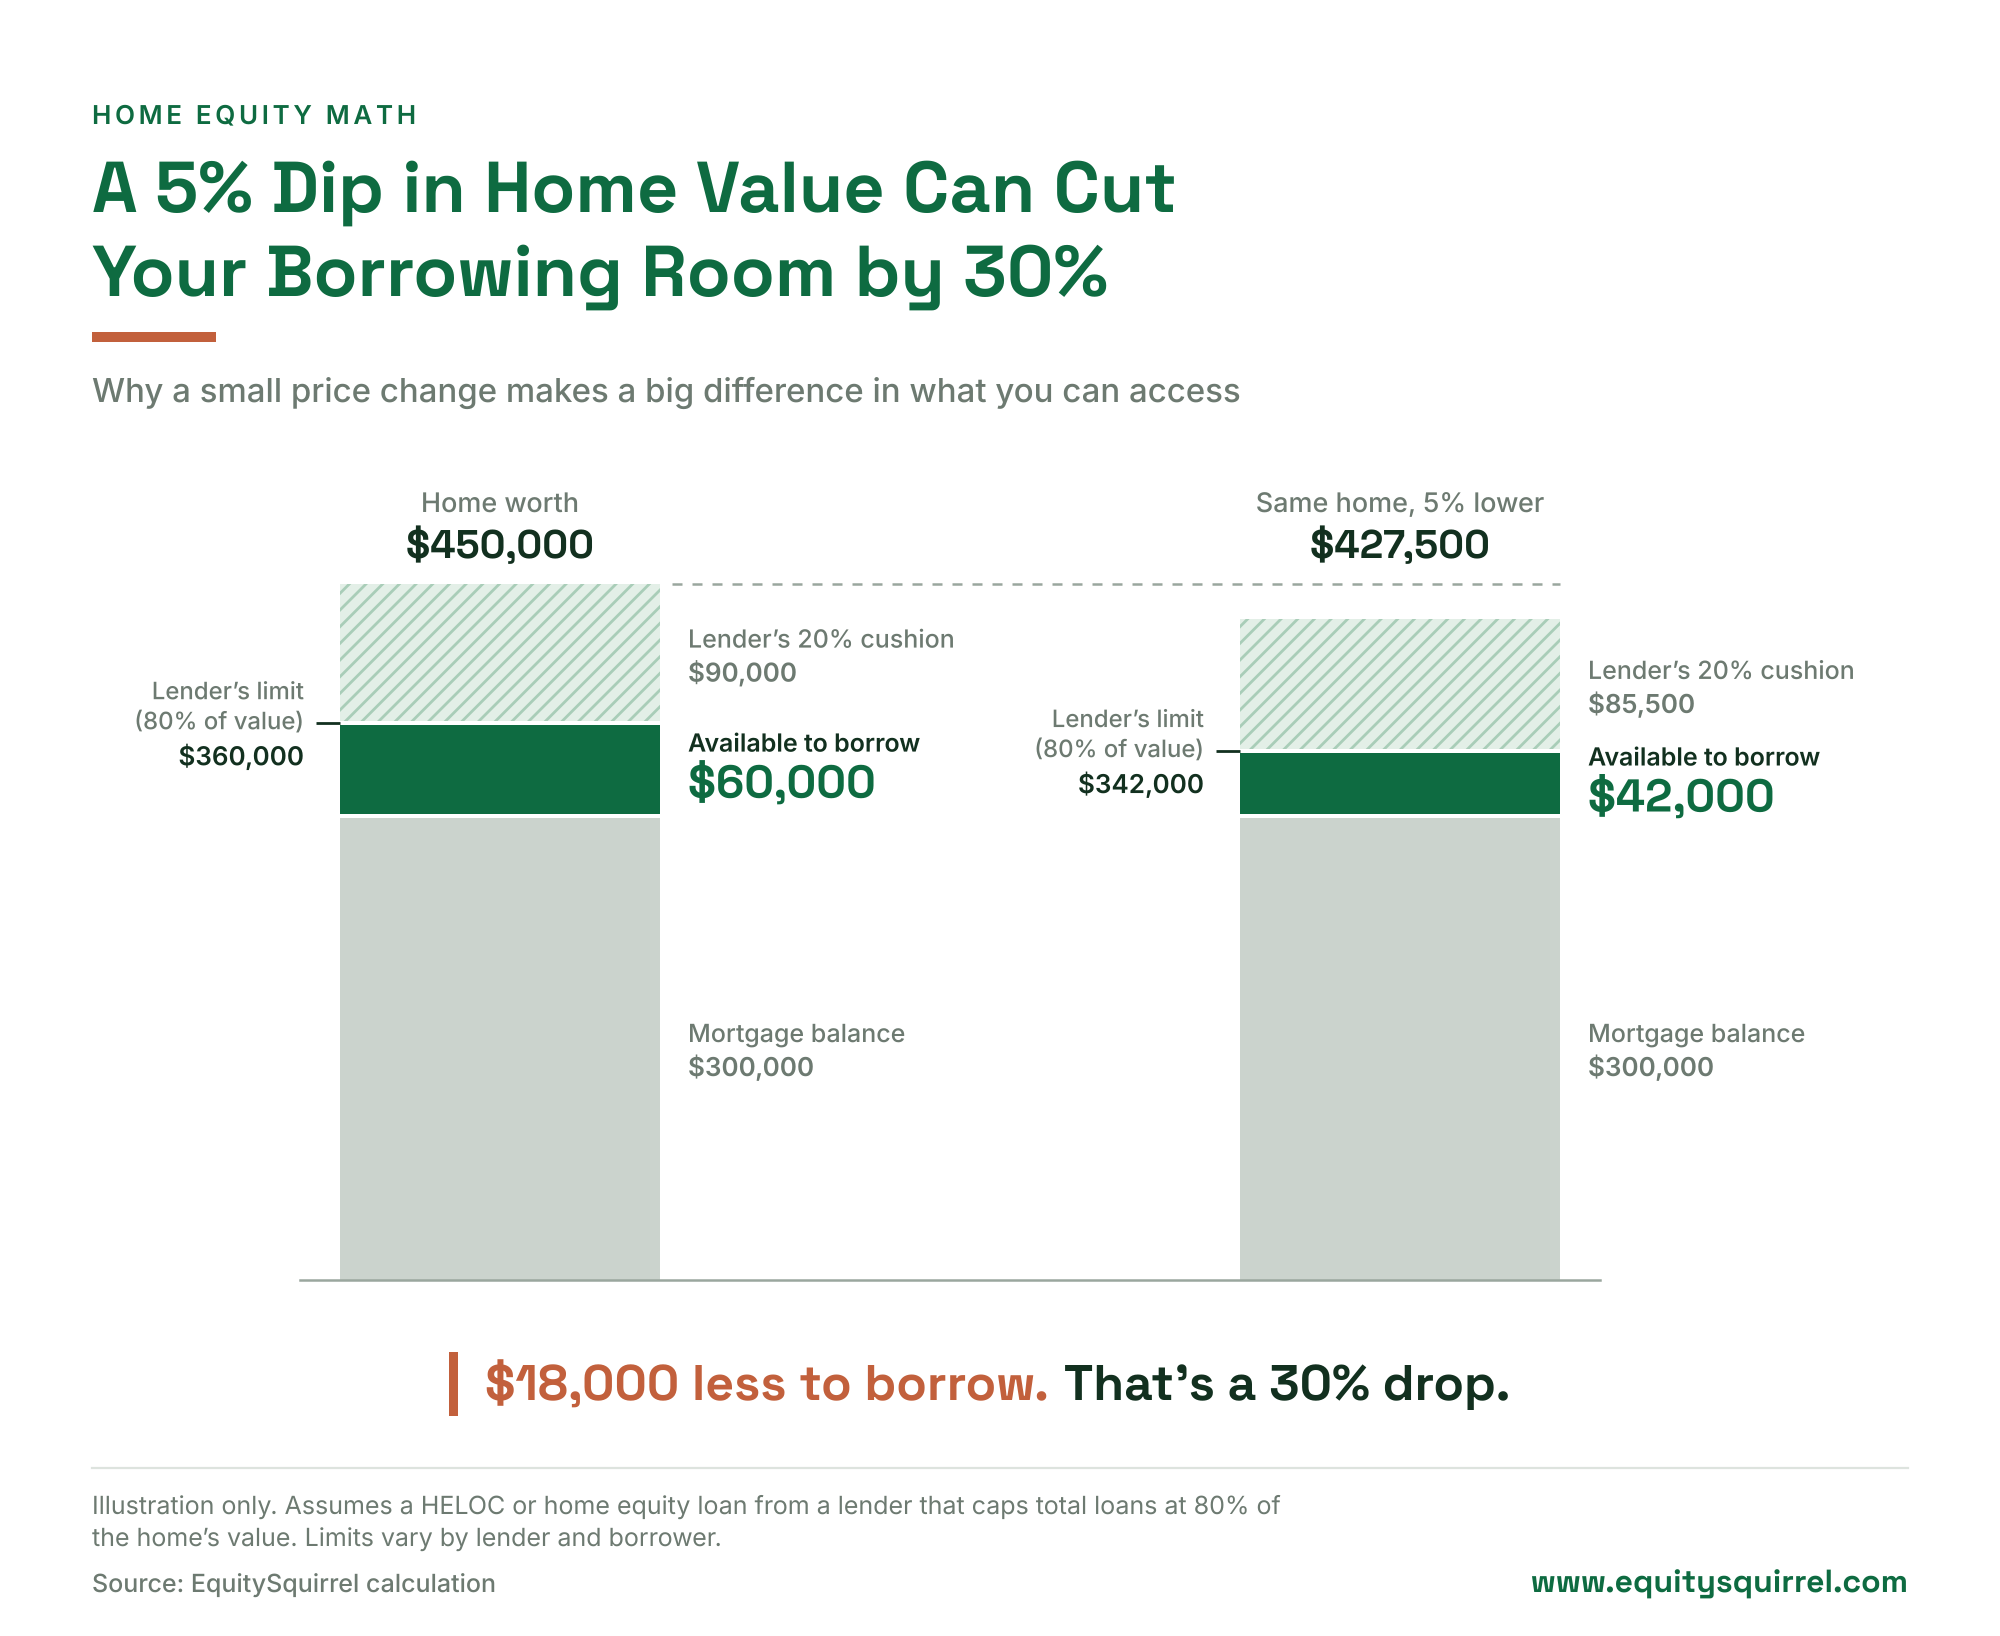
That space shrinks faster than home prices do. Take a home worth $450,000 with a $300,000 mortgage and a lender that stops at 80%:
- At $450,000, the lender’s limit is $360,000. Subtract the $300,000 mortgage and $60,000 is available.
- If the home’s value slips 5% to $427,500, the limit drops to $342,000. Now $42,000 is available.
The home lost 5% of its value. The amount available fell by $18,000, which is 30%.
You can run your own numbers with our HELOC calculator.
Scout’s Tip
Before you apply for a HELOC, compare what lenders are charging right now. A lower rate matters more when your borrowing room is tight. See current Arizona home equity rates to get a baseline.
If you are considering a home equity investment. A home equity investment, or HEI, gives you a lump sum today in exchange for a share of your home’s future value. It has no monthly payments, and it is not a loan. Equity still matters. Each company sets its own limit on how much you can already owe on the home, so check the HEI equity requirements and which states each company serves before you apply.
Featured Partners · No Monthly Payments

- Up to 30 years to settle
- Credit scores starting at ~600+
- Access up to $600,000

Home Equity Agreement (HEA)
- Use cash for anything
- 500+ credit score. No income requirements.
- Pre-qualify in under 2 minutes. No credit impact.

- Qualify in minutes. No credit impact.
- Close in as little as 3 weeks1
- Works for second homes and rentals

- Qualify in minutes
- Dedicated Investment Manager
- Access up to $600,000

- Up to 30 years to settle with MaturityMatch™
- Keep your low-rate mortgage
- Check eligibility with no credit impact
Unlock: In exchange for cash upfront, you give a share of the future value of your home. Not all homeowners will qualify. Not available in all states. Terms and conditions apply. Home Equity Agreements offered by Unlock Home Equity Solutions Inc. (NMLS #2657081).
Nada: 1“Close in as little as 3 weeks” reflects the average timeline under standard conditions. Actual timelines vary based on documentation, title, property location, and local recording or notarization requirements. Timing is not guaranteed. Terms and conditions apply. Not all homeowners will qualify. Not available in all states. Nada Loans LLC, NMLS #1993600.
If you plan to sell. Your equity is what you walk away with after the loans and the costs of selling are paid. If your number is above 80%, get a net proceeds estimate from an agent before you list, so there are no surprises at closing.
If you already have a HELOC. A lender can lower your credit limit or pause new draws if your home’s value falls by a significant amount. If you are counting on an open line for a project, ask your lender how it handles this.
What If You Bought Your Home Recently?
Recent buyers have the thinnest equity cushion, but that only becomes a problem if you need to sell or refinance soon. Being short on equity does not change your monthly payment or your right to stay in your home.
The numbers show who is most exposed. Mortgage data firm ICE reported in August 2026 that about 813,000 mortgage holders were underwater. Of those, 85% took out their loan in 2022 or later, and three out of four used a low-down-payment FHA or VA loan.
If that sounds like you, three things help:
- Time. Every payment lowers your balance, and you build equity even if prices stay flat.
- Staying put. If you do not need to sell, a dip in value is a paper loss.
- Knowing your number. Run the three-step check above once or twice a year so you know where you stand before a big decision, like opening a HELOC soon after buying.
If you know someone who bought after 2022 and is worried, this is the section to send them.
Which States Lost the Most Ground?
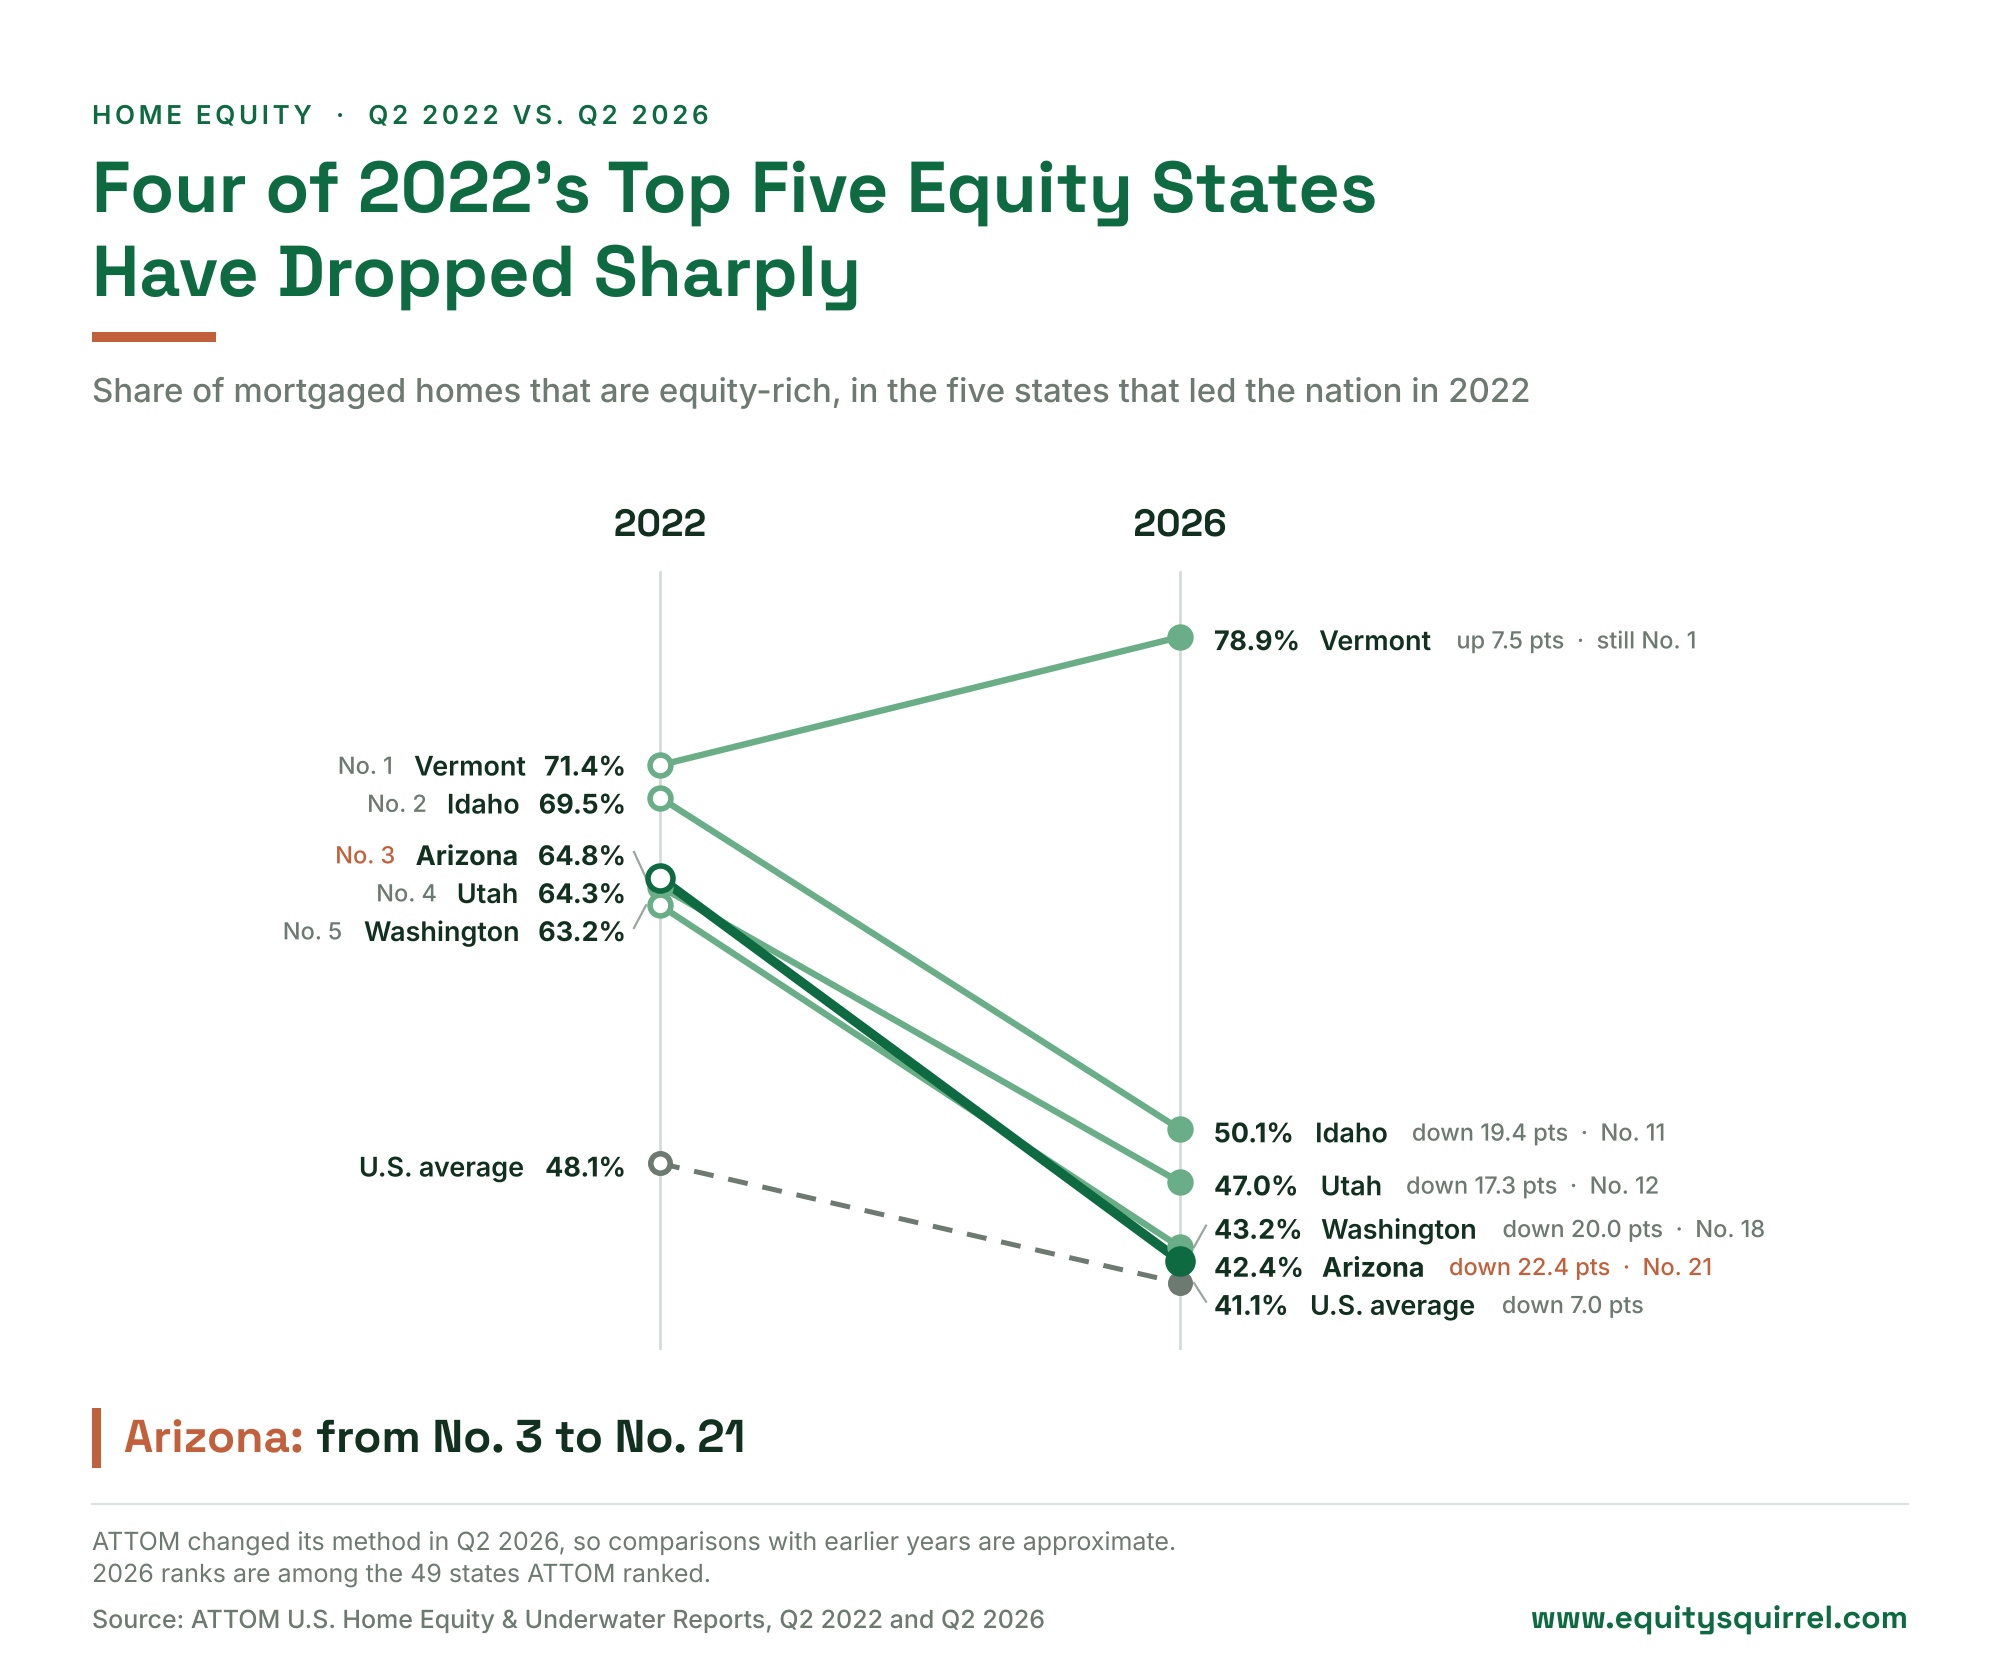
Four of the five states that led the country in home equity in 2022 have dropped sharply since. Vermont is the exception.
In the second quarter of 2022, the top five were Vermont, Idaho, Arizona, Utah and Washington. Here is where they stand now:
- Vermont: 71.4% then, 78.9% now. Still No. 1.
- Idaho: 69.5% then, 50.1% now. No. 2 then, No. 11 now.
- Arizona: 64.8% then, 42.4% now. No. 3 then, No. 21 now.
- Utah: 64.3% then, 47.0% now. No. 4 then, No. 12 now.
- Washington: 63.2% then, 43.2% now. No. 5 then, No. 18 now.
Over the same four years, the U.S. average moved from 48.1% to 41.1%.
Why Does Minnesota’s Number Look So Low?
Minnesota’s drop does not line up with its home prices, which points to a change in how the data is counted. Its equity-rich share went from 37.6% to 20.1% in one year, the largest fall of any state. Over the same period, Cotality reports that home prices rose in every Midwest state.
ATTOM changed its method in the second quarter of 2026. It now leaves out cases where one large loan is secured by several properties. That change makes comparisons with earlier years less exact, and ATTOM has not said how much of any state’s change it explains. Treat the year-over-year numbers as a guide to direction, not a precise measure.
What Happened to Home Equity in Arizona and California?
Both states have seen a sharp drop in equity-rich homeowners. They also happen to be home to many of our readers.
Arizona. In the second quarter of 2022, 64.8% of Arizona’s mortgaged homes were equity-rich, the third-highest share in the country. In the second quarter of 2026, it was 42.4%, which ranks 21st. Arizona used to sit almost 17 points above the U.S. average. Now it is about one point above.
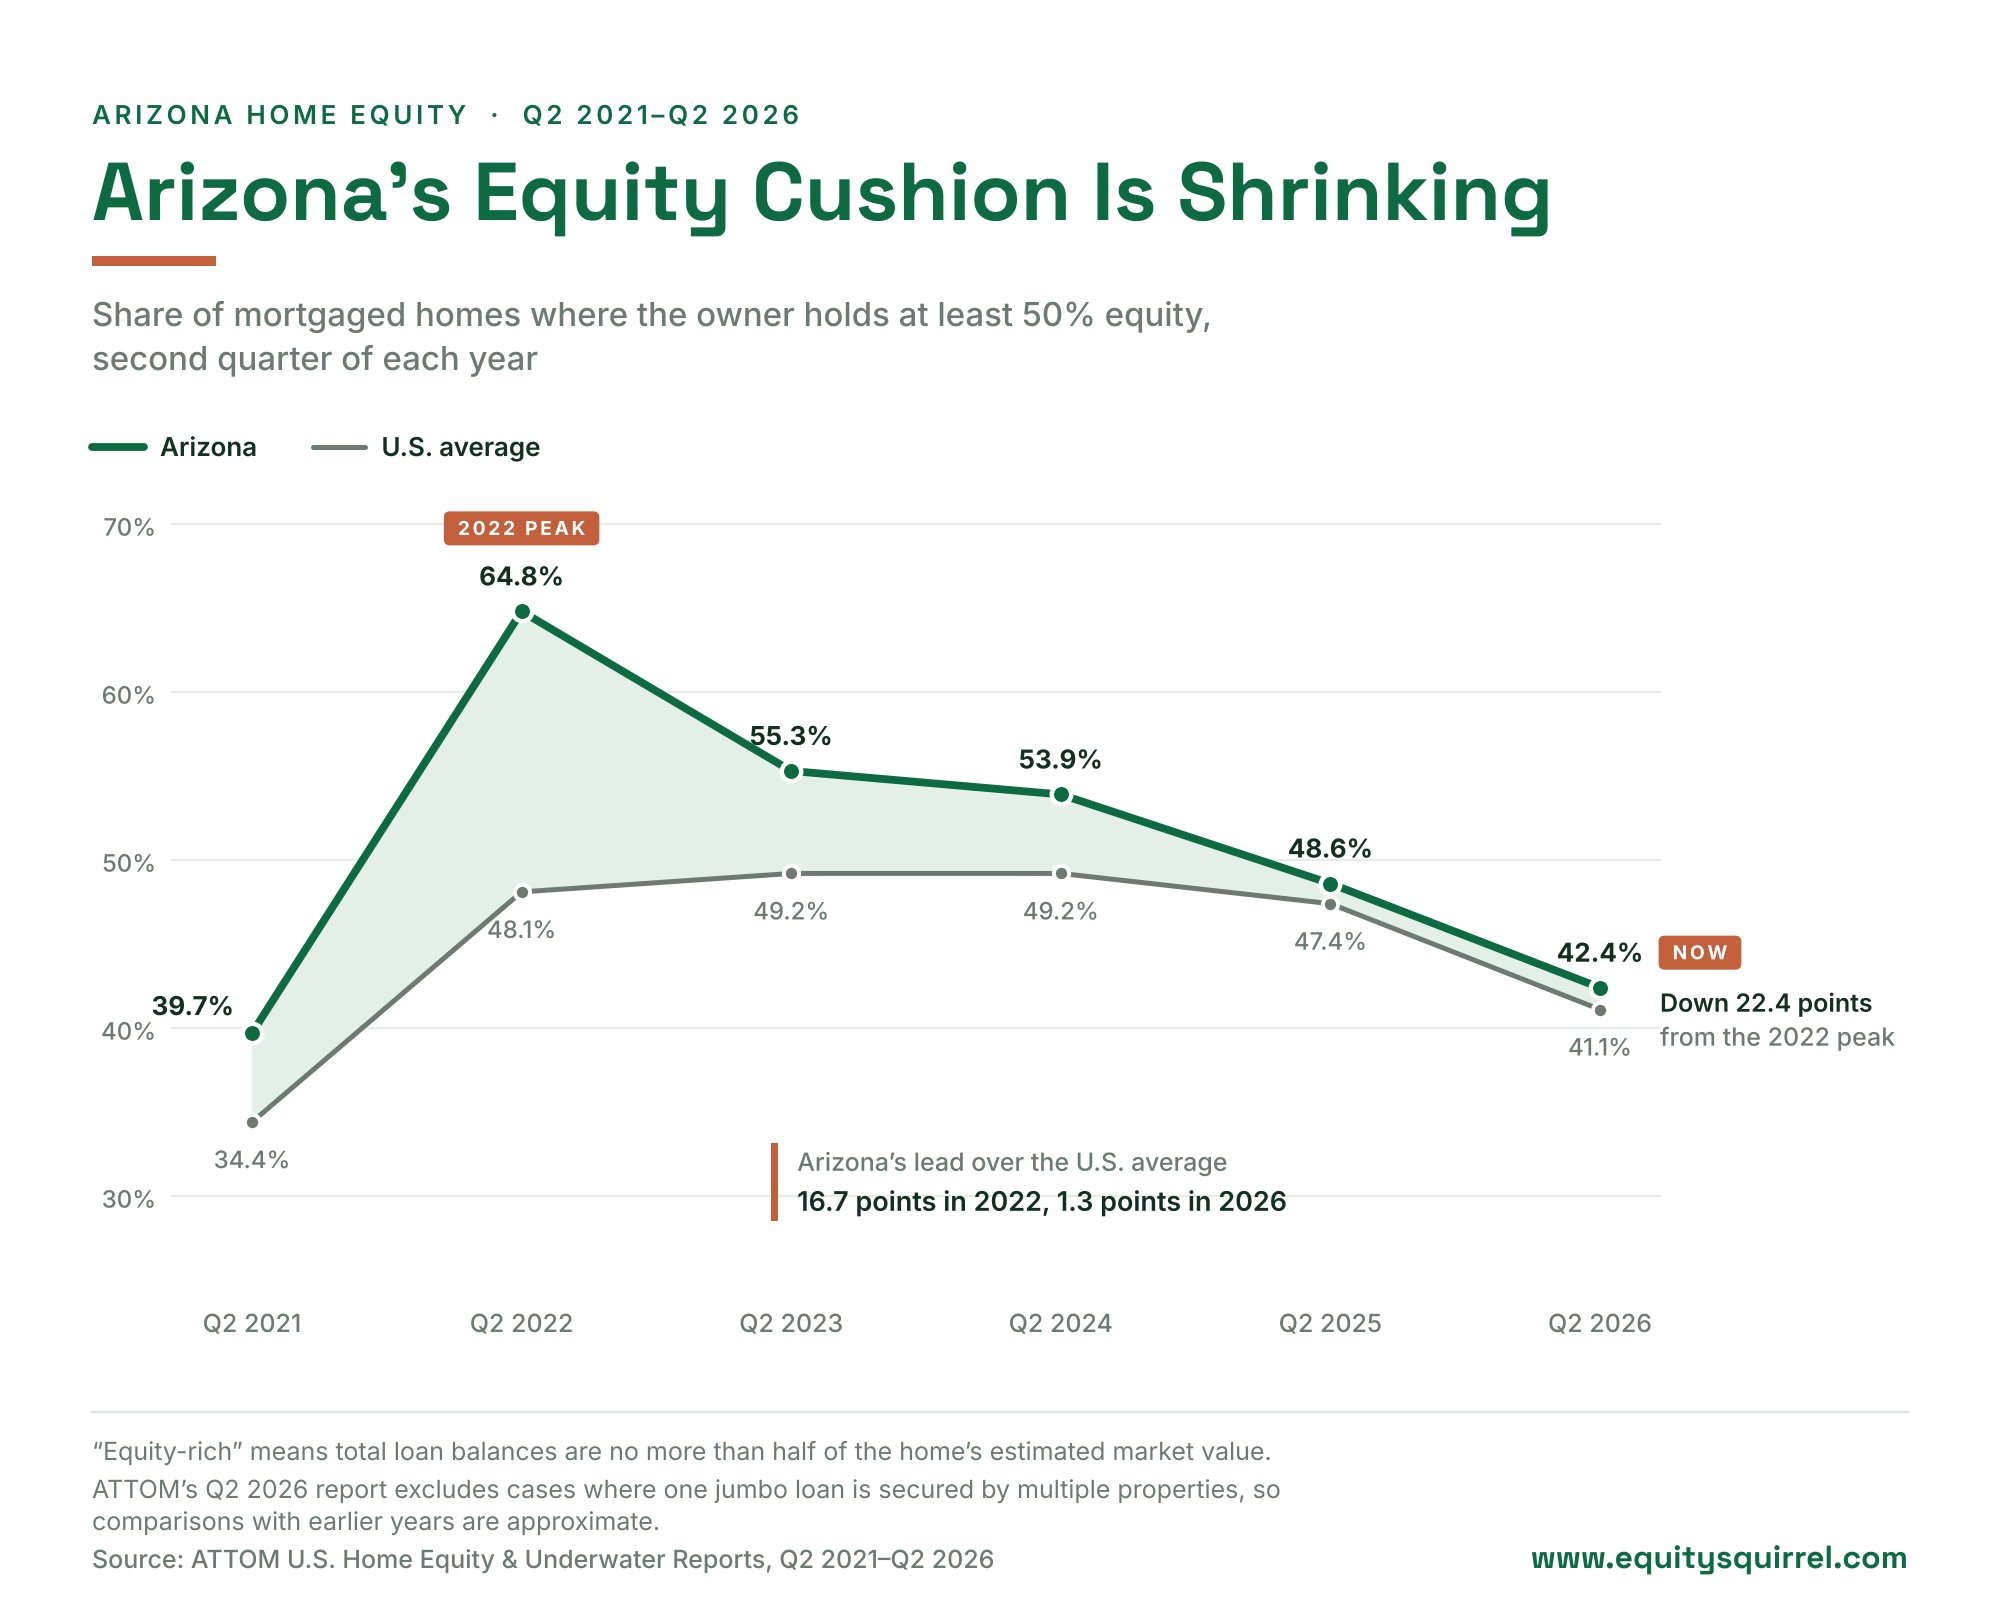
Arizona home prices explain much of it. Federal housing data shows Arizona prices rose only about half a percent in the year through the second quarter of 2026. Research firm Cotality found that the average Arizona borrower lost about $23,900 in equity during 2025, the third-largest loss of any state.
California. California’s equity-rich share fell from 56.9% to 45.6% in one year, one of the largest drops in the country. It still ranks 14th. Cotality put the average California borrower’s equity loss at about $24,700 for 2025.
If you are an Arizona homeowner weighing your options, our Arizona HELOC guide and Arizona home equity investment guide cover the local details.
Arizona homeowner with equity to work with? See if you pre-qualify with Nada in minutes, with no impact to your credit.
Why Are Fewer Homeowners Equity-Rich?
Three things are shrinking the equity-rich share: home prices have stalled in former boom markets, recent buyers have joined the count, and more owners are borrowing against their homes.
- Prices stalled where they had climbed fastest. Cotality reports that prices in Washington, Colorado and Texas are up less than 1% since June 2022. In Rhode Island, Connecticut and New Jersey, they are up 30% to 31%.
- Recent buyers start with less equity. Someone who bought near the peak with a small down payment is a long way from the 50% mark. Each new buyer like that pulls the state’s share down.
- More owners are borrowing against their homes. ATTOM counts every loan on a property. ICE found that second-mortgage lending in early 2026 had its strongest first quarter in nearly two decades, and about 3.9 million owners who took out mortgages from 2020 to 2022 now have a second loan on the home. Credit bureau TransUnion reported HELOC openings were up about 20% from a year earlier in the second quarter of 2026.
There is a twist worth knowing. Total home equity in the U.S. is at a record high. ICE put it at $18 trillion in the second quarter of 2026. Both things can be true at once. The total keeps rising because homes are worth more than they were years ago. The equity-rich share falls because fewer owners sit below the 50% line.
It also helps to zoom out. In early 2020, only 26.5% of mortgaged homes were equity-rich. Today’s 41.1% is well above that.
Should You Tap Your Equity Now or Wait?
The answer depends on whether you need the money, not on where the market is headed. Nobody can time home prices, but the outlook can help you weigh the choice.
Forecasters expect little price growth next year:
- Fannie Mae expects its home price index to rise 0.6% in 2027.
- The Mortgage Bankers Association expects price growth to slow in 2027.
- Zillow says home values are “more likely to remain relatively flat rather than decline outright.”
Both Fannie Mae and the Mortgage Bankers Association also expect mortgage rates to stay above 7% through 2027.
Here is how to think it through:
- If you need funds for something specific, flat prices mean waiting is unlikely to grow your borrowing room. If prices in your area slip, waiting could shrink it.
- If you do not need funds, there is no reason to rush. Borrowing has a cost, and taking money you do not need is not a hedge against falling prices.
- If monthly payments are your concern, remember that HELOC rates usually move up and down over time. Our HELOC vs. HEI calculator compares the payment and long-term cost of each path.
Scout’s Tip
If a new monthly payment does not fit your budget, a home equity agreement is a different route. Unlock offers a lump sum in exchange for a share of your home’s future value, with no monthly payments. See if your home qualifies with Unlock.
Forecasts change often, and no forecast is a promise. Talk with a licensed financial professional before you make a decision about your home equity.
Frequently Asked Questions
Equity-rich means the loans against a home add up to half or less of what the home is worth. A homeowner who owes $200,000 on a $450,000 home is equity-rich. The term comes from ATTOM, which tracks it for homes that have a mortgage.
Yes. A lender can reduce your credit limit or pause new draws if your home’s value falls by a significant amount. If that happens, ask the lender why and whether it will review a new valuation.
Many lenders cap the total loans on a home at 80% to 85% of its value, including your current mortgage. That usually means you need to keep at least 15% to 20% equity after the new line is added. Credit score, income and existing debts also affect approval.
Use it as a starting point only. Lenders order their own valuation, and it can come in lower than an online estimate, especially where prices have cooled. Recent sales of similar homes nearby are a better guide.
If you can keep making your payments and do not need to move, you can usually wait. Each payment lowers your balance. If you must sell or are falling behind, contact your mortgage servicer or a HUD-approved housing counselor before you miss a payment.
No. ATTOM’s equity-rich figures cover only homes that have a mortgage. Homes owned free and clear are not counted.
How We Sourced This
The figures in this article come from the sources below. The borrowing-room example is our own calculation.
- ATTOM, Q2 2026 U.S. Home Equity & Underwater Report: national equity-rich share and the method change
- ATTOM, equity-rich properties by state, Q2 2026: state table and ranks
- ATTOM, Q2 2022 U.S. Home Equity & Underwater Report: 2022 top five states and U.S. average
- ATTOM, Q4 2025 U.S. Home Equity & Underwater Report: early 2020 equity-rich share
- ICE, August 2026 Mortgage Monitor: record $18 trillion in equity and underwater borrowers
- ICE, June 2026 Mortgage Monitor: second-mortgage lending
- TransUnion HELOC data, via American Banker: HELOC originations
- Cotality, US Home Price Insights, November 2026: home prices by state and region
- Cotality, Homeowner Equity Report, Q4 2025: 2025 equity losses in Arizona and California
- Federal Housing Finance Agency, House Price Index: Arizona price change
- Fannie Mae, Housing Forecast, October 2026: home price and mortgage rate forecasts
- Mortgage Bankers Association, October 2026 forecast: price growth and mortgage rate outlook
- Zillow, September 2026 market report: home value outlook
- Office of the Comptroller of the Currency, HelpWithMyBank.gov: HELOC limit reductions when home values fall
- CrossCountry Mortgage: typical 80% to 85% lender limits
Update log
- November 2026: Published with second-quarter 2026 data.
EquitySquirrel is an educational resource operated by Scout Media LLC, not a lender or HEI provider. This content does not constitute financial, legal, or investment advice. HEI terms vary by provider and are subject to change; confirm current terms directly. Consult a licensed financial professional before making decisions about your home equity. Aleksandra Kadzielawski, Lic #SA694336000.